

The stock exchange is the most renowned avenue of investing money in most economies. The
term, “investing” might seem analogous with “seeking value”. However, that is often not the case.
Most investors invest their money going by market sentiment, and based on tips and news that they get from their environment. They rarely look into the fundamentals of the instrument they are investing in, and make their decisions on other factors, such as price trends, non-public information and intuition. The assumptions of rationality, where an investor chases the stock which is intrinsically the strongest in comparison, are frequently violated. Hence, market indicators such as indices are mostly driven by speculation, and seldom show fundamental values, and consequently, the true condition of the economy.
Gains through investment in stock, or simply put, returns, can be broadly divided into
“Fundamental Returns” and “Speculative Returns”. As the name suggests, fundamental returns are composed of gains in stock value through dividend pay-outs and an increase in the earnings made by the firm. It is very intrinsic to the firm, and is largely a result of its own decisions and operations. It has considerable control over these variables.
Speculative returns, on the other hand, are mostly out of the control of the organisation. They are mostly in the form of changes in the price earnings ratio of the stock. Speculative returns show no real value added to the world by the firm. It is a sort of revaluation in the minds of investors. It is a form of return to the shareholder because participants of the market are willing to pay more for the same firm earning the same amount of earnings and distributing the same dividends. It may be due to market sentiment, future expectations or intuition.
To analyse things better and more objectively, we will take into account the performance of NIFTY 50, and try to segregate the fundamental and speculative components from each other. NIFTY 50 is the free float market capitalisation weighted index for 50 stocks listed on the National Stock Exchange of India. It was launched in 1996 with a base value of 1,000.
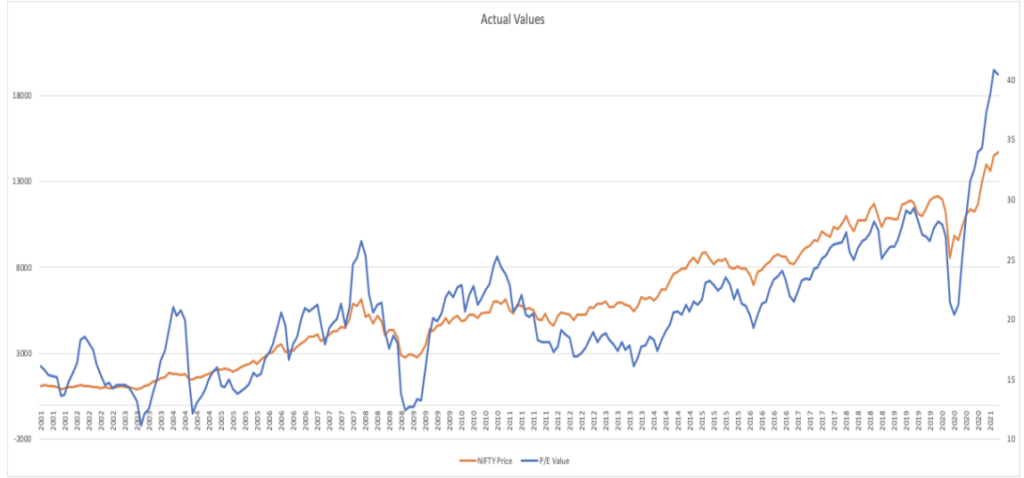
The above graph plots the monthly values of NIFTY 50 and the Price Earnings ratio of NIFTY 50 from April 2001 to March 2021. As visible, the PE Ratio (blue line plotted on the right axis) closely follows and imitates the NIFTY 50 itself (orange line plotted on the left axis). This is a direct and sheer indicator of speculation based on market sentiments. When there is a bull run, i.e. prices are continuously rising for some time, the market becomes optimistic. Players start to feel that this trend will continue, and value assets more than they used to, so that they can benefit from selling at higher prices even after accounting for the ‘premium’ paid.
Similarly, when there is a bear run, i.e. prices are continuously falling for some time, the market becomes pessimistic. Players start to feel that prices will continue to fall further, and value assets lesser than they used to, so that they feel they booked profits when prices were high.
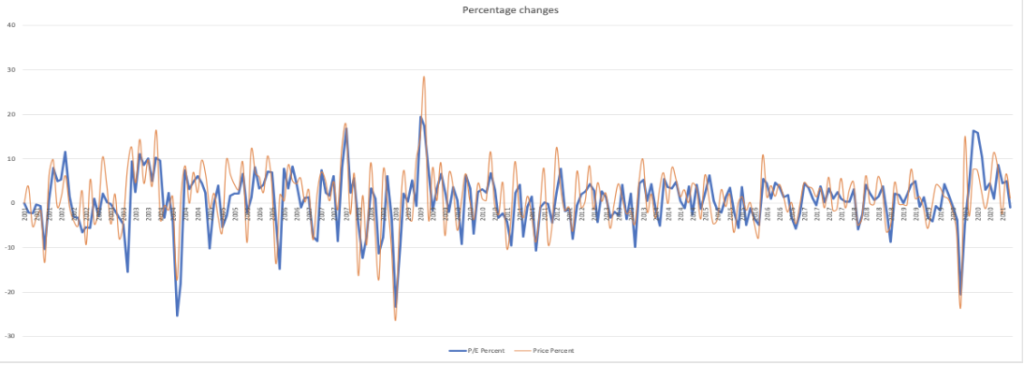
The above graph plots monthly percentage changes in NIFTY (orange line) and monthly
percentage changes in NIFTY PE (blue line) over the same time frame as the previous graph.
As clearly visible, the percentage change in PE is almost always in the same direction and
similar order of magnitude as the change in NIFTY prices. This shows a hands down clear
correlation of the two.
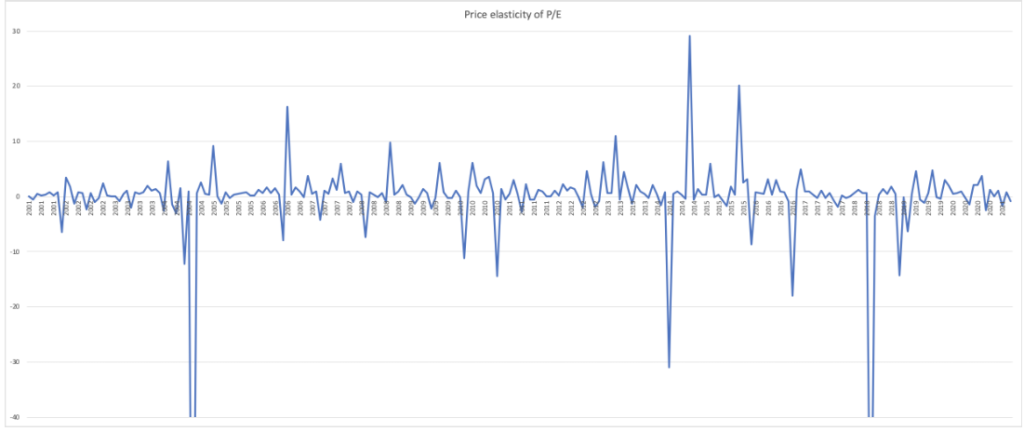
The above is a graph of the elasticity of NIFTY PE with NIFTY. Apart from a few exceptional
cases, overall, the elasticity is always positive. This shows that the direction of movement of PE and NIFTY is the same. Hence, it shows that people change their valuation based on market trends and sentiments, and not the company’s earnings. In fact, the average elasticity over the 240 observations (ignoring extreme outliers) was found to be 0.589. In over two-thirds of the cases, elasticity was positive, which shows unidirectional movement. Moreover, the massive variations in elasticity go on to show how volatile the stock market is. Not only is it speculative, but the amount of speculation also varies greatly.
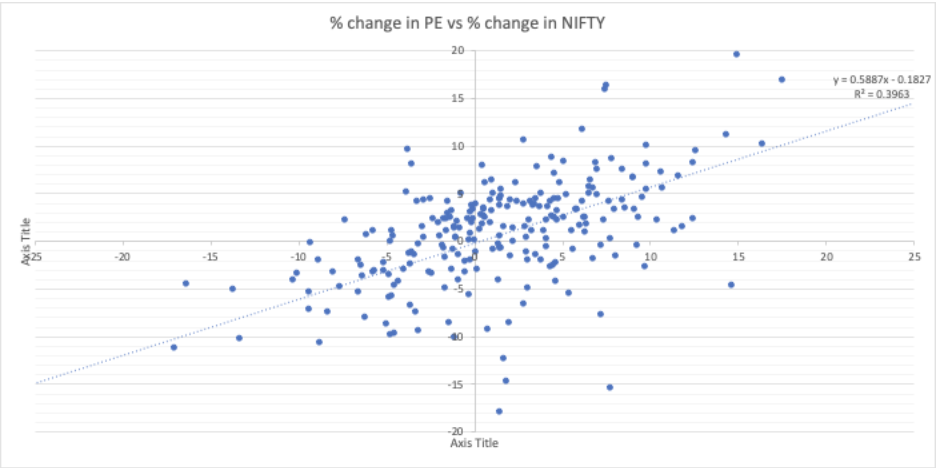
The graph above is a scatter plot of % changes in NIFTY and % changes in NIFTY PE. A best
fit line has also been drawn for the same. Again, the positive correlation is clearly visible. The
best fit line has a slope of 0.5887, suggesting a direct and unidirectional relation between the
two variables. Through analysis of data and visualisation of charts we can safely conclude that returns provided by the stock market are not completely fundamental. Part of the returns are fuelled by PE changes, which are speculative in nature. Though, these returns are what attract investors to the stock market and entices them to put their money in. This liquidation of idle funds prevents leakages and helps the economy grow.
Through the above analysis we observed inertia bias closely, where people think that the trend
which has been ongoing will sustain and continue. While the market does rise steadily when
seen in the long run, its behaviour in the short run is volatile and unpredictable. Such biases are many. For instance, greenhorn investors who make profits on their initial bets seem to attribute the success to their own merit and investing capability. However, that is not the actual case more than often.
The profits might be through sheer coincidence of favourable news, foreign investment inflow, or even because of the general market trend itself. Another bias that exists is of the belief that history will repeat itself. Investors frequently are of the opinion that certain incidents and price movements that happened in the past will happen again. This leads to unproven theories and intuition taking over their investment decisions. Therefore, investors must be careful while choosing their investments. They must research well into the assets, take a thorough look into its fundamentals and determine its intrinsic value.
Written by- Keshav Todi
Edited by- Sohini Roy